Modeling vessel performance at sea can be enormously complex.
A short, and incomplete list of some of the factors that may affect the performance of a vessel at sea are:
- the type of vessel, its size and shape, above and below the water line.
- if the vessel is a sailboat:
- the wind direction and strength.
- the sails the boat is carrying, and the condition they are in.
- the combination of sails the boat will fly in different wind and sea conditions.
- how frequently the crew is willing to change sail combinations.
- if the crew has different sail combination rules during daylight and at night.
- if the vessel is a motorboat:
- the vessels average motoring speed.
- the vessel speed heading into, across and running with various wind speeds.
- the wave state (direction, height and period for wind waves and swell.)
- any leeway created by hull shape, wave state and amount of heel.
- the condition of the crew (are they fresh or tired?)
- the comfort / discomfort the crew is willing to put up with.
- the risk appetite of the crew (conservative or not.)
- the voyage length and willingness to accept damage to the boat.
- how clean is the vessels bottom (is it covered in barnacles?)
Any computer simulation of a vessels performance is only going to be an approximation of its true performance. The weather routing system will be unable to exactly match your vessels speed in its calculations. However, even a close approximation to your vessels performance will allow you to gain valuable insight into weather systems and how your vessel may move through them.
Creating performance data.
There are a variety of ways people have come up with to create these vessel speed estimates.
Two of the main methods of creating vessel performance data are:
- actually measure the vessel performance in a wide range of conditions.
- use a computer simulation of the performace using a system called a Velocity Prediction Program, or VPP.
Both of these methods can create a table of condition/speed values. The most common way to present these tables is in something called a Polar Diagram. The term Polar Diagram, or Polar is often used to refer to the performance data itself.
Sailboat Polar diagrams.
Here is an example of a polar diagram, as presented in LuckGrib:
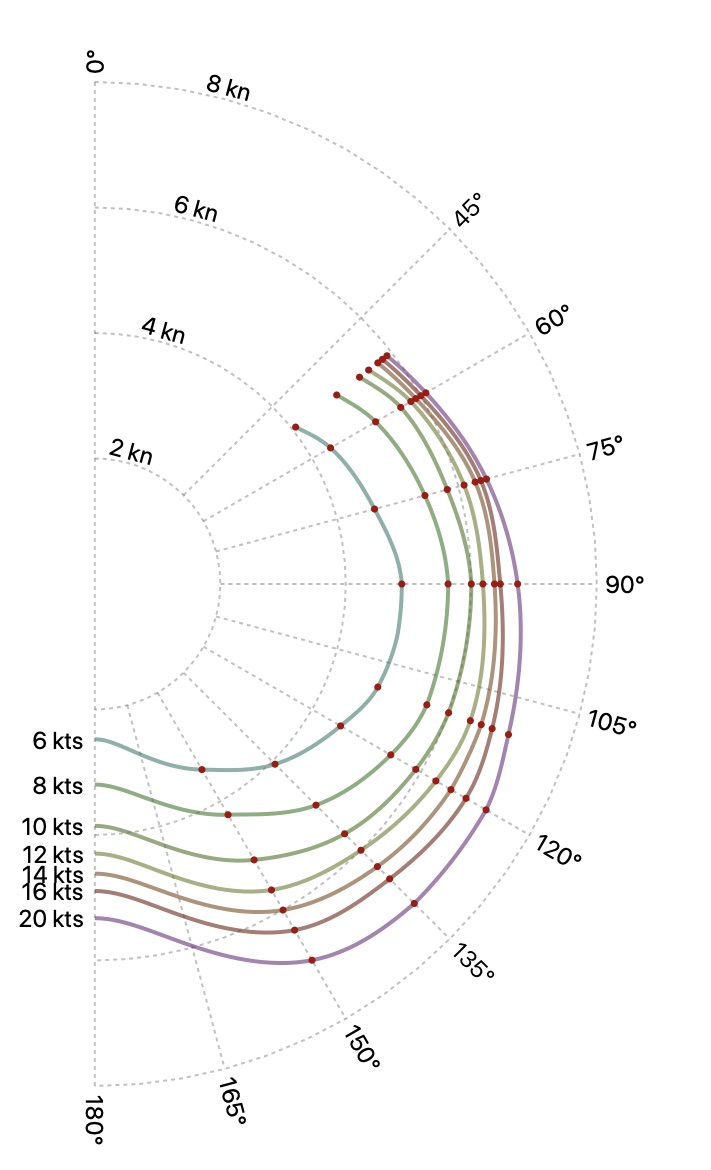
There are a few points to know when reading this diagram:
- the top of this diagram, labelled 0°, is the bow of the boat.
- the bottom, labelled 180°, is the stern.
- this diagram is symmetric for port and starboard, only starboard is shown.
- the polar diagram is a radial graph with boat speed being zero at its center and increasing as the graph moves out. The maximum boat speed shown on this graph is 8 knots.
In the example diagram above, there are 7 wind speed performance curves. Each curve represents a true wind speed. This diagram is modeling vessel performance for the wind speeds: 6, 8, 10, 12, 14, 16 and 20 knots.
A point on any of those performance curves represents the true wind angle of the wind, and how fast the boat will travel for that combination of true wind speed and true wind angle.
Reading the diagrams.
After becoming familiar with polar diagrams, you can read them and see how a vessel performs in various wind combinations. For example, the vessel above sails much slower dead downwind than while reaching. Notice that the speeds at 180° are much slower than at 135° or 90° for example.
It looks like this boats fastest sailing angle is around 130° true (this true angle will of course move forward when you consider apparent wind speeds and angles.)
Interpolation.
The actual polar file will contain relatively few data points. In the example polar diagram above, the red dots represent actual data points from the file. Across each wind speed interval provided in the file, the system is generating smooth interpolations.
Notice that the file does not contain a data point for when the true wind angle is 0°. For sailboats, the assumption is that the boat speed will reach 0 knots when the true wind angle is 0°.
In order for the weather routing system to solve its routing problem, it needs to determine the vessel speed given a combination of true wind speed and angle. The application will generate interpolated values, based on the polar diagram, for the requested evaluation points.
Solver settings.
There are two cautionary notes regarding the interaction beween the weather router solver and these polar diagrams.
The first cautionary note is regarding impossibly high sailing angles. Note above that there is an assumed boat speed of 0 knots at a 0° true wind angle. However, the speed curve will fall smoothly from the last data point in the file to 0 knots. This can be seen by examing the isochrones from the solver. For example, here is an image presented earlier:
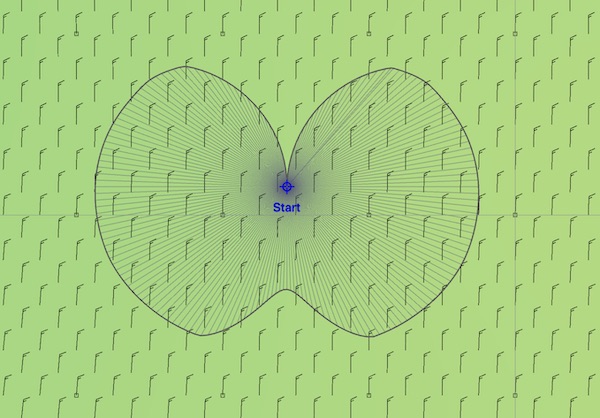
Notice that the speed is falling slowing from a high wind angle down to 0 knots. However, there are many sailing angles that are impossible in that picture. A sailboat will not be able to sail at 10° to the wind.
LuckGrib allows you to set sailing angle limits, both upwind and downwind. So while the polar diagram may be reflecting impossible wind/angle combinations, you solve this easily by changing a setting and telling the solver what your upwind and downwind sailing limits are. For example:
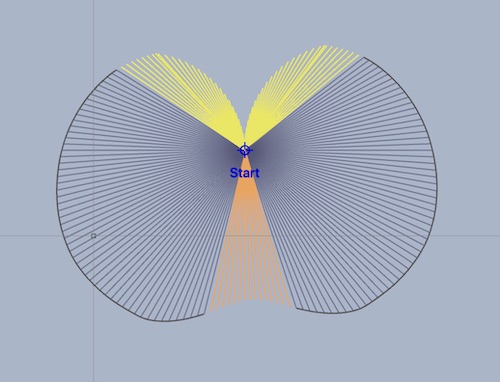
This picture shows the first isochrone for the same vessel as in the previous picture, but with the upwind sailing limit set to 35° apparent and the downwind limit set to 165° true. The yellow lines indicate headings that are invalid due to their violating the upwind angle limit, the orange lines are violations of the downwind limit.
Only the sailing angles which do not violate the limits are considered by the solver. The paths generated will respect the sailing angle limits you set. There is no need for these limits to be represented in the polar diagram file.
The other cautionary note is that if the weather router encounters wind speeds which are beyond the maximum value in the polar diagram, the system will assume that the vessel speed will match that on the highest wind speed curve provided. This implies that you would reef the boat down as the wind speeds increases and maintain the boat speed. This may not be realistic.
There are settings available in the LuckGrib WR system that allow you to avoid areas where there is too much wind for your comfort, or to heave to when the winds become too strong.
Obtaining your polar diagram.
If you have a polar diagram file from your vessel manufacturer or a VPP calculation, you can import the file and use it. Also, LuckGrib comes with a catalog of polar diagrams for a variety of vessels.
There are a number of ways for you to adjust the polar diagrams so they more closely reflect your vessels performance. You can use these tools to quickly adjust a polar which is similar to your vessels performance, but not exactly the same.
For example, if the catalog has a sailboat similar to yours but for a different length, and you think that the general shape of the performance curves are a good match for your vessel, you can use the sample from the catalog and easily apply a scale to its speeds.
You may find a sample polar which has a good shape match to how your vessel performs from other manufacturers as well. When looking for a sample polar to start with, consider similar boats, from the same or other manufacturers. The sample you start with can be adjusted to more closely match your boat.
Read the manual.
There is additional information in the manual on this topic.