You can view a weather route as a meteogram of values across its length.
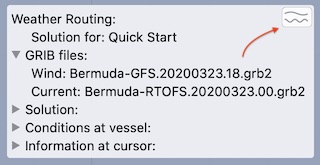
On the Mac, this is accessed by clicking on the button in the top right corner of the weather routing text information group:

On iPad and iPhone, you access the WR meteogram by tapping anywhere on the WR information window, similar to how the GRIB meteogram is brought up.
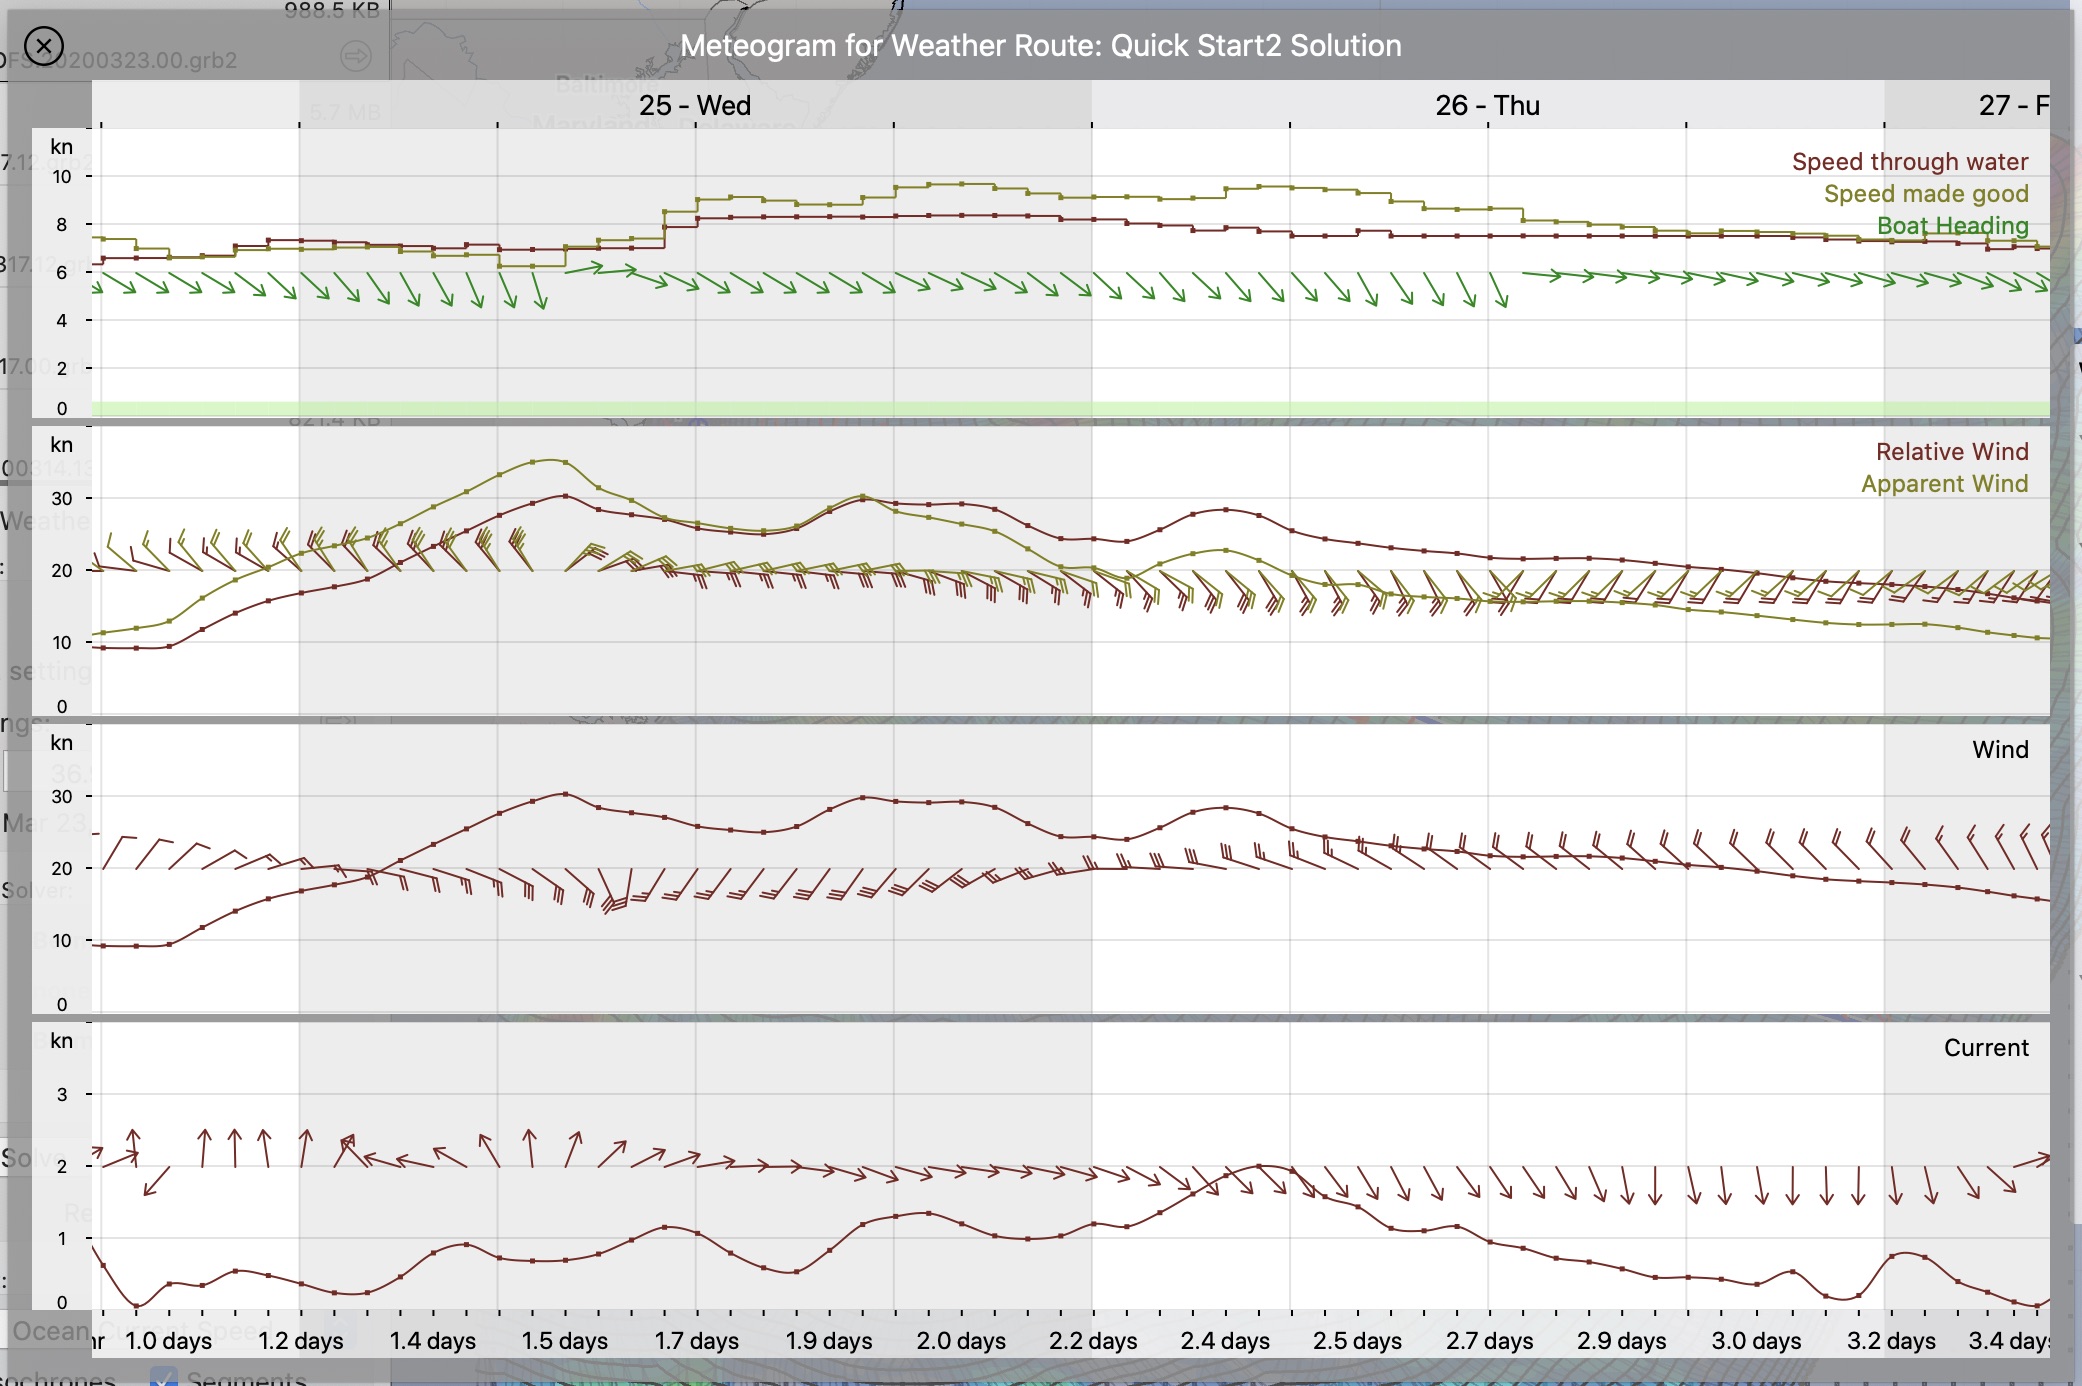
After displaying the WR meteogram, you will see something like the sample shown below:
 (Click above for larger version.)
Note that the first row, where the vessels speed through water is shown is a little unusual. The speed is shown as a graph with abrupt changes, steps rather than a smooth curve. This correctly reflects what the isochrone algorithm is doing. The boat speed is determined at the start of each isochrone and then held constant until finishing that isochrones time interval. This is followed by the wind being evaluated at the new location and next isochrone time, which in turn, determines the speed for the following interval.