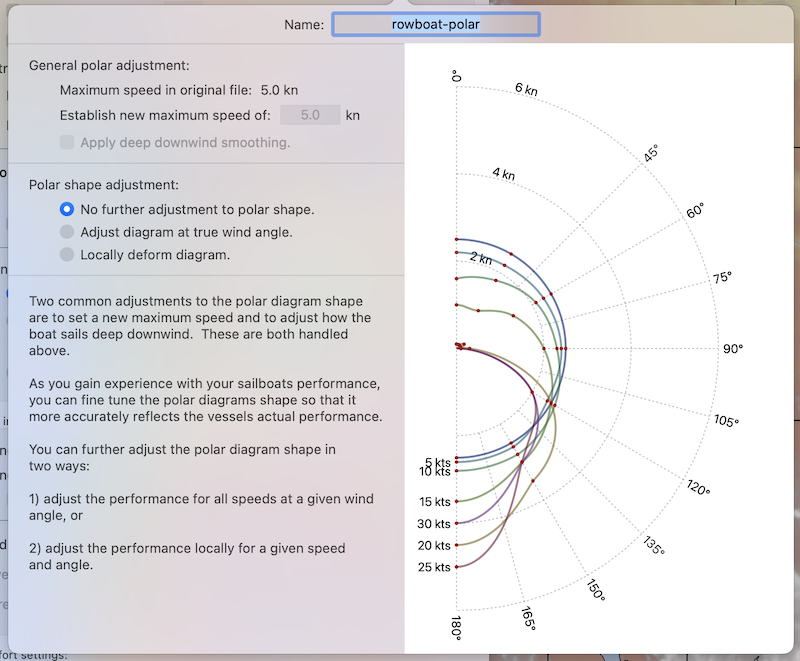
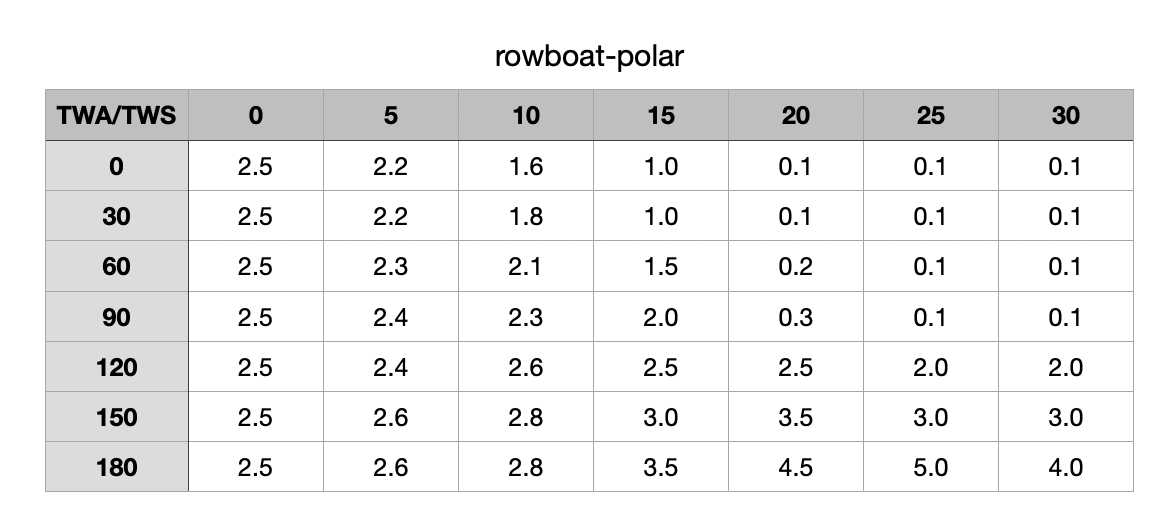
 Example rowboat polar, by David Burch.
LuckGrib can be used to help understand how a rowboat will move through weather systems on a multi-day voyage.
There are no polar diagram (performance) files provided in the app for rowboats. You will need to understand some of the basic performance characteristics of your rowboat and create your own polar diagram file.
While LuckGrib does not support some of the highly specialized rowboat voyaging requirements, the weather routing solutions that can be generated should prove useful in both strategic and tactical planning.
Creating your own rowboat polar file
 Example rowboat polar, by David Burch.
First, read the section which details how to import a polar diagram from a spread sheet. Read through all of the pages in this section, including how to export the data. In this example, the Apple spread sheet app, Numbers, will be used.
You will need to decide how many wind speeds to model, along with how many different combinations of wind speed / wind angle to provide data for. The application will generate smooth interpolations between the values you provide.
In the example above, wind speeds from 0 up to 30 knots are used, along with true wind angles from 0 (the bow) to 180 (the stern.)
The rowboat speed when the wind speed is 0 knots is fairly easy - it should be the speed you can row the boat in calm winds and will be the same in all directions. Then as the wind starts to increase, the boat will have more difficulty rowing into the wind and may speed up when the wind is at its stern. These performance values could be determined through experimentation, talking to the boat designer, or in some other way.
Important note: boat speeds less than around 0.1 can not be used. The app does not allow negative boat speed values, and zero is used to indicate missing data (this last is a strange artifact of polar diagram files.) Note in the file above that the slowest speeds are 0.1 kts - this effectively indicates the rowboat has stopped (moving only 2.4nm in 24 hours.)
There is an interesting article published by David Burch which provides some background to this process.
When the spread sheet is setup in a way you feel is close to right, export it as a CSV file (as detailed in the section linked above.)
Sample data.
Two files have been provided by David Burch, which is the data used to generate the images above:
(Note that David has provided this data as an example, it is not meant to accurately model any particular combination of rowboat and crew.)
Note that you MUST export the data from Numbers as a CSV (or TSV) file. LuckGrib is not able to import the Numbers file directly.
The CSV file has had its filename extension changed to .pol, which makes the file easier to import into LuckGrib on iPhone or iPad.
Limitations
In the article linked above, David points out that there are some ocean and weather conditions which would prove quite challenging for a rowboat. Some of these are:
- if the wind is strong enough on or near the bow of the boat, the rowboat may go backwards.
- there are conditions where the best options for a rowboat will be to deploy a sea anchor of some form.
- strong waves arriving on the beam of a rowboat may cause rolling, making it difficult to row.
- on a long voyage, depending on the size of the crew, the rowboat may slow down, or stop, for periods when the crew is sleeping.
The Weather Routing system in LuckGrib was designed to work with sailboats and motorboats. When generating routing solutions for a rowboat you will need to be aware of a number of limitations.
With respect to the first point above, you are unable to model negative boat speeds in LuckGrib. As mentioned above, the lowest boat speed should be around 0.1 kts.
LuckGrib is unable to model the effects of deploying a sea anchor. If you have set the vessel comfort settings to avoid maximum wind above some speed, and the router is unable to generate a path due to the wind exceeding the threshold, then you will want to consider your options (including rowing backwards, depoying a sea anchor, etc.)
On the third point above, LuckGrib is currently unable to alter the rowboat polar performance based on waves arriving from different directions. It is simplistic, but you may want to build assumptions of a fully developed sea, for each of the true wind and speed / direction combinations in the polar diagram to account for rowboat rolling and any slowdown that may cause.
There are different strategies on how to deal with rowboat crew sleep cycles. If there is only one person on the rowboat, they can use the sailing speed scale setting in the vessel settings for the rowboat. The sailing speed scale can be used to slow down the rowboat performance. One simple example is that, assuming you sleep for 8 hours in a day, you would be rowing for 16 hours, which results in a scale of 66% (16 / 24 * 100.) Through experimentation you may want to adjust this up and down.
Adjusting the polar
As you gain more experience with the rowboat performance in various wind conditions, come back and adjust the polar diagram data.
Also, as you get a feel for how much of the rowboat performance you are able to take advantage of during a day (due to sleep or working on other chores) you can modify the vessels sailing speed scale.
Not perfect!
The goal will not be perfection, but rather, having the rowboat performance be modeled closely enough that the system is able to generate solutions which help you understand the weather systems and your routing decisions.