There are a number of ways a sailing polar diagram can be adjusted.
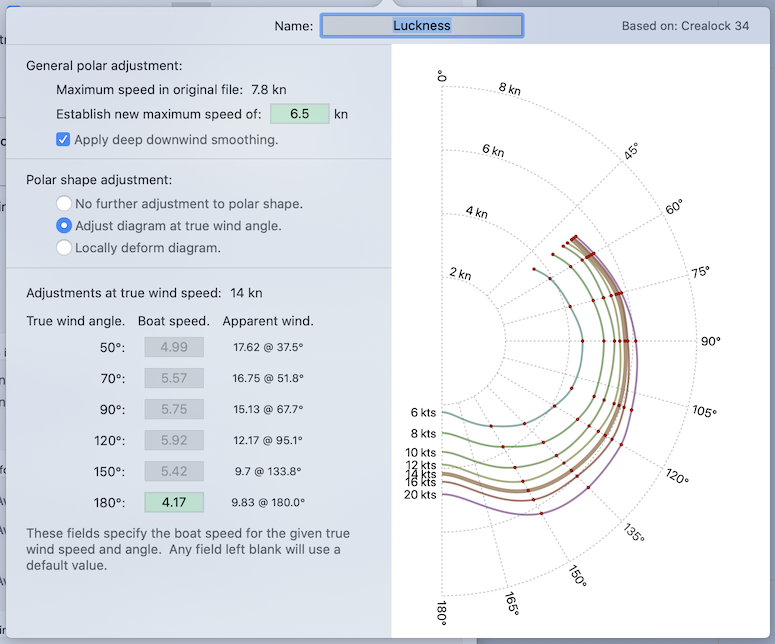
Note that each of the text fields may have a default value, which is shown as a grey value. When you want to provide a new value for any field, simply click in the field and type in a new value. All of the values you provide, which override the default values, are shown with a light green background. In the example above, two values have been provided, all others use their default values.
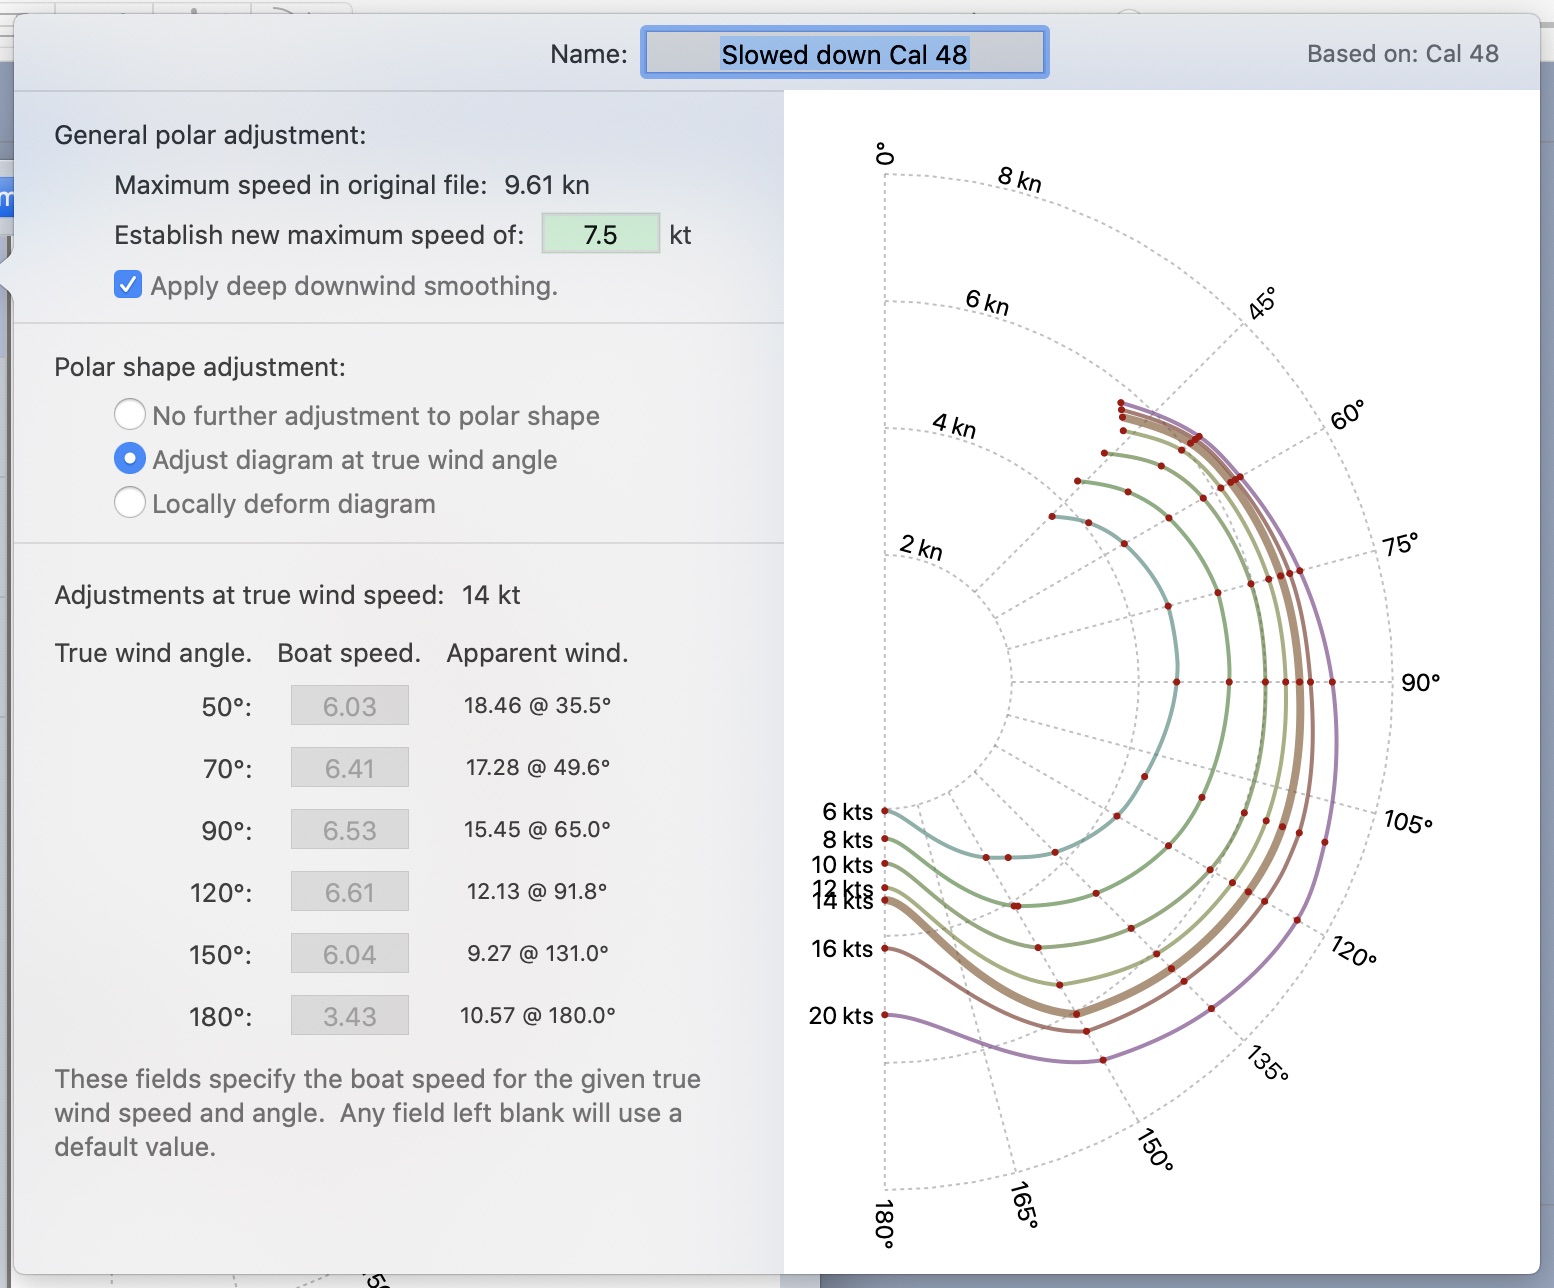
Maximum speed.
If you are starting with a sample polar which has its maximum speed too high or low, you can specify the maximum speed you want to use for your vessel. This is a simple scale value that is applied to the polar. The shape of all the curves is not affected by this maximum speed.
Deep downwind smoothing.
If the sample polar you have selected is using a spinnaker, and you want to try to remove its effect, try using this setting.
The easiest way to get an idea of what this setting does is for you to give it a try.
Note that the downwind performance of this vessel can be further adjusted, using the controls described below.
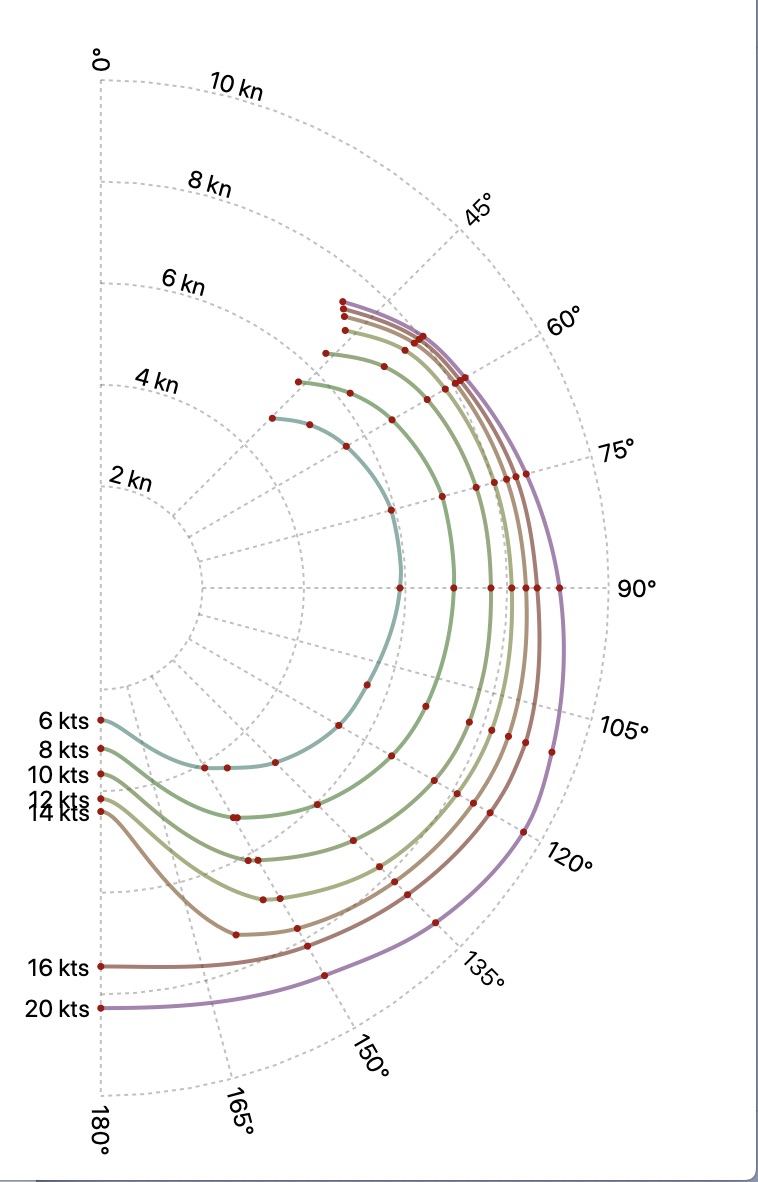
Adjusting shape at true wind angles.
This editor allows you to make small changes to the shape of the polar diagram. The shape is performed for the 14 knot wind speed curve, and then the other curves are modified to match the adjustment. Try it to see how it works.
Note that when you deform the polar diagram, large changes can lead to the diagram behaving poorly. You are encouraged to start with small changes. Larger changes may require also adjusting neighboring values to give them a shape which accomodates the initial change.
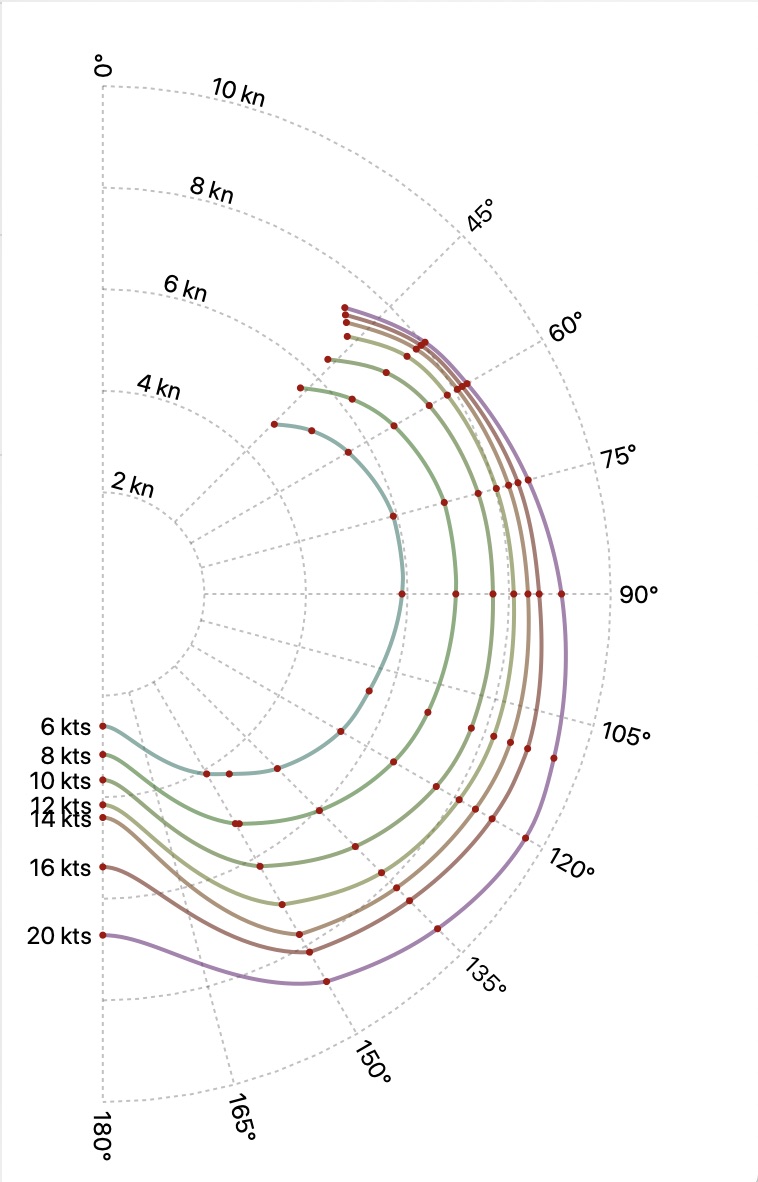
Local deformation of diagram.
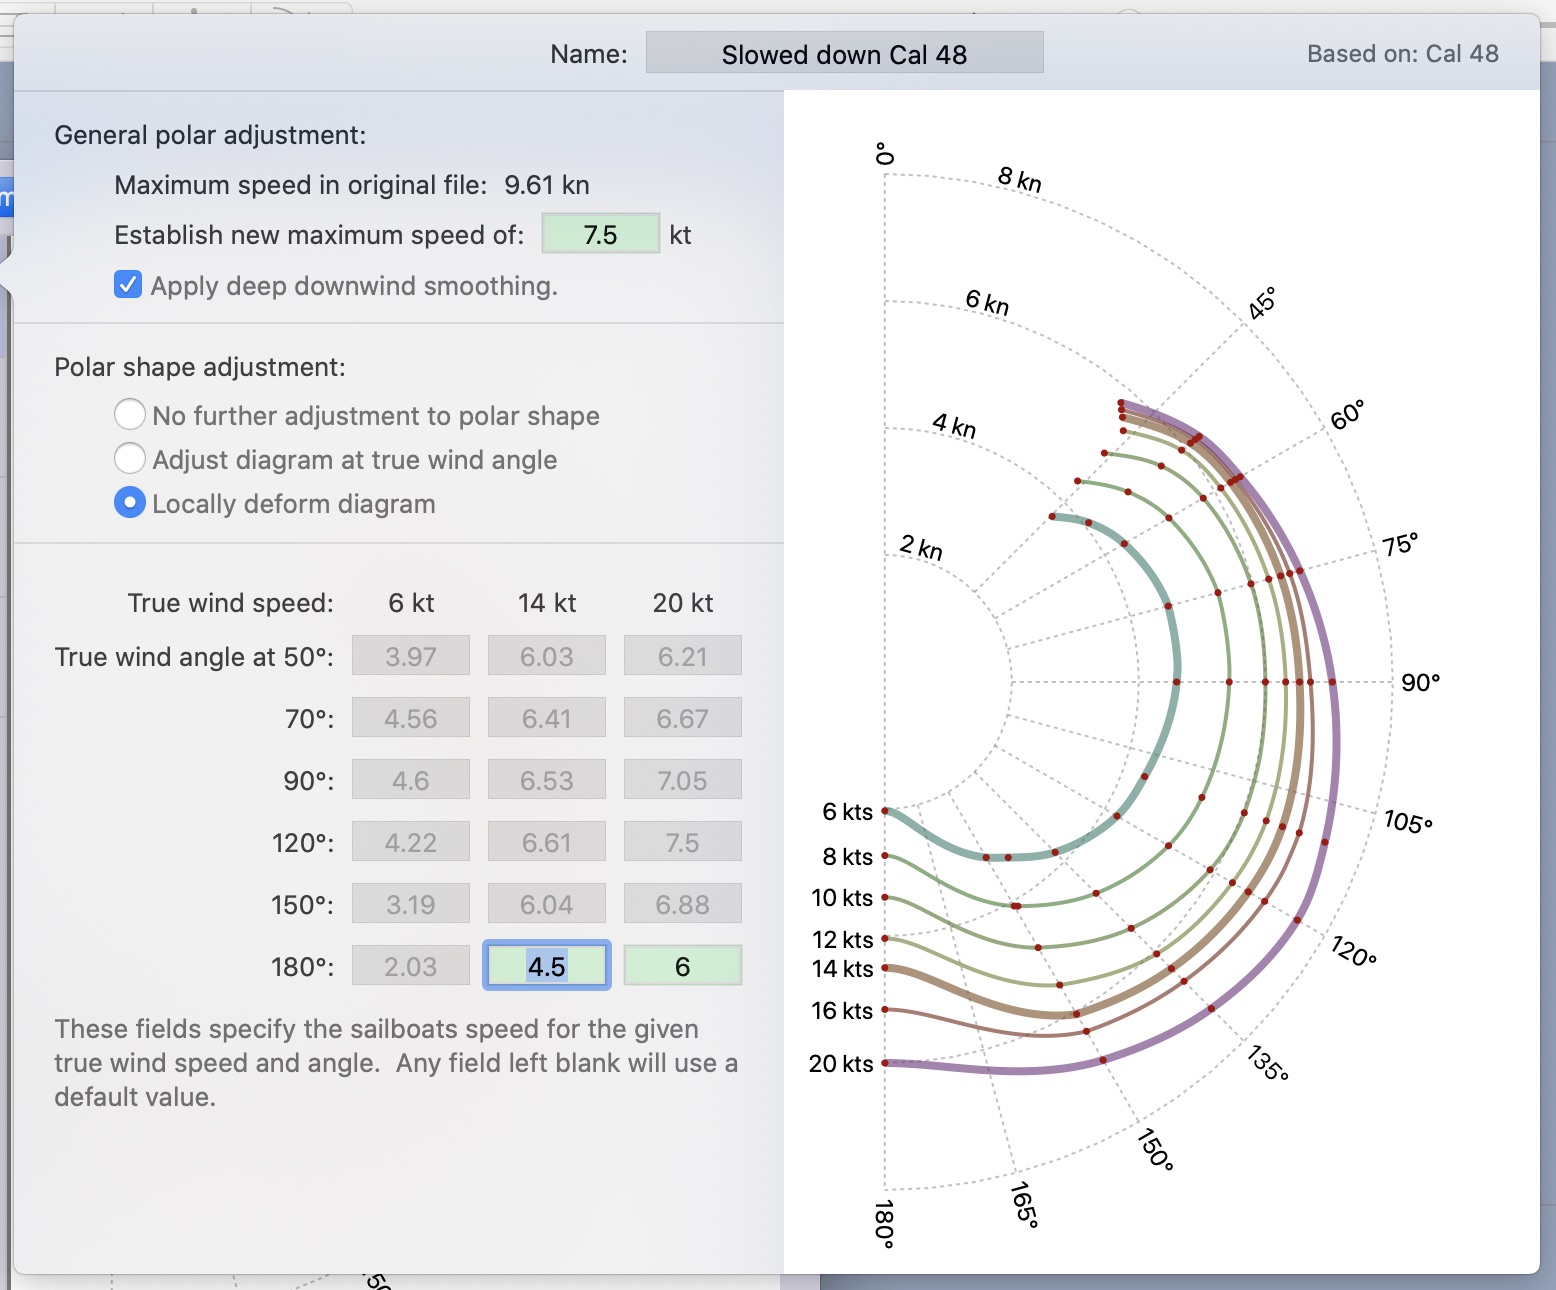
This editor allows you to make small changes to the shape of the polar diagram for three different true wind speeds, as shown above. This will allow you to make finer adjustments to the diagram.
As with the editor described above, large changes can lead to the diagram behaving poorly. You are encouraged to start with small changes. Larger changes may require also adjusting neighboring values to give them a shape which accomodates the initial change.